R Shiny for Interactive Data Visualization – A Case Study
conference
| 🗓️ Event | General Online Research 2019 |
| 📅 Date | 8 March 2019 |
| 📍 Location | Cologne, Germany |
| 🌐 Language | English |
| 📥 Materials | Slides (PDF) |
| 💻 App | Patent Explorer |
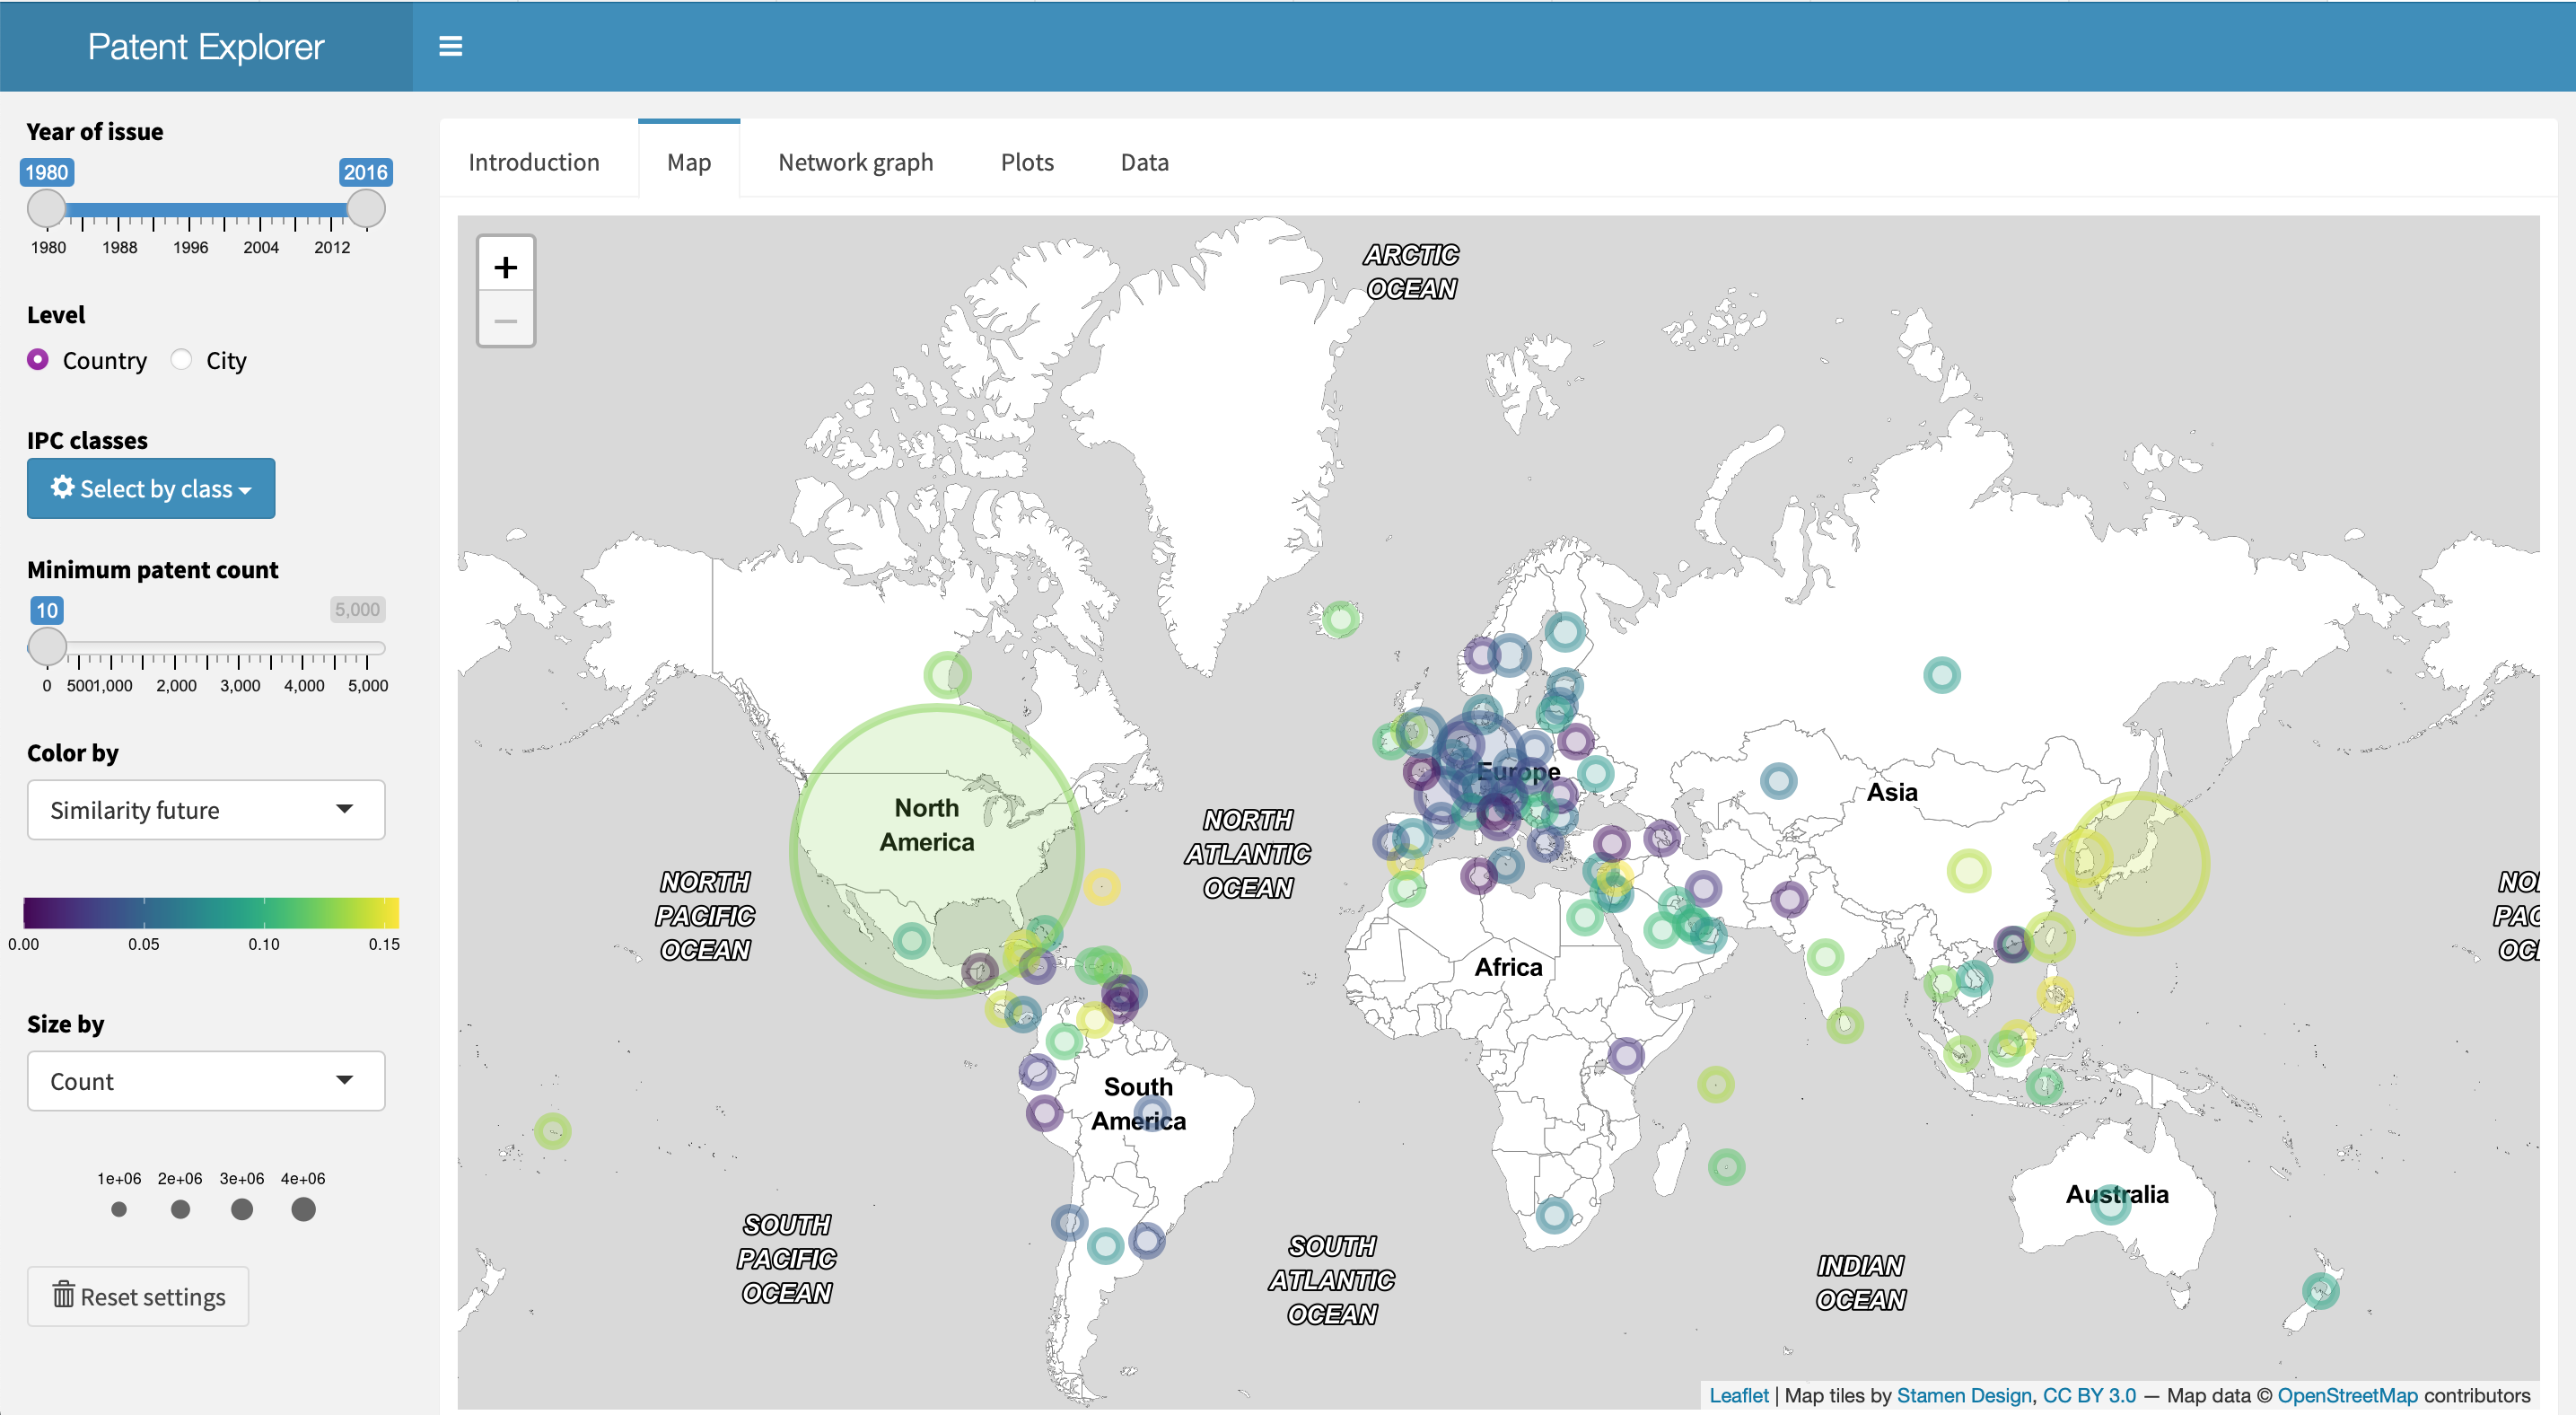
An overview of R Shiny by example of an app I developed for visualizing patents on a world map and as a network graph of related patents. The presentation introduces R Shiny, hosting Shiny apps and the pros and cons of Shiny compared to other approaches.